Extract and fit clusters from an input graph.
Usage
extractClusters(
  graph,
  data,
  group = NULL,
  membership = NULL,
  map = FALSE,
  verbose = FALSE,
  ...
)
Arguments
- graph
Input network as an igraph object.
- data
A matrix or data.frame. Rows correspond to subjects, and columns to graph nodes (variables).
- group
A binary vector. This vector must be as long as the number of subjects. Each vector element must be 1 for cases and 0 for control subjects. Group specification enables node perturbation testing. By default,
group = NULL.- membership
A vector of cluster membership IDs. If NULL, clusters will be automatically generated with
clusterGraphusing the edge betweenness clustering ("ebc") algorithm.- map
Logical value. If TRUE, the plot of the input graph (coloured by cluster membership) will be generated along with independent module plots. If the input graph is very large, plotting could be computationally intensive (by default,
map = FALSE).- verbose
Logical value. If TRUE, a plot will be showed for each cluster.
- ...
Currently ignored.
Value
A list of 3 objects:
"clusters", list of clusters as igraph objects;
"fit", list of fitting results for each cluster as a lavaan object;
"dfc", data.frame of summary results.
Author
Fernando Palluzzi fernando.palluzzi@gmail.com
Examples
# \donttest{
# Nonparanormal(npn) transformation
als.npn <- transformData(alsData$exprs)$data
#> Conducting the nonparanormal transformation via shrunkun ECDF...done.
adjdata <- SEMbap(alsData$graph, als.npn)$data
#> Bow-free covariances search. Use method: cggm ...
#> Number of bow-free covariances / df : 220 / 420
#> Max parent set(S) / Sparsity idx(s) : 10 / 4
#> Number of clusters / number of nodes: 2 / 31
#>
# Clusters creation
clusters <- extractClusters(alsData$graph, adjdata, alsData$group)
#> modularity = 0.5588502
#>
#> Community sizes
#> 3 2 1 4
#> 4 8 9 11
#>
#>
cluster= 1 of 3
cluster= 2 of 3
cluster= 3 of 3
#>
#>
#> Found 3 clusters with > 5 nodes
print(clusters$dfc)
#> cluster n.nodes n.edges dev_df srmr V.pv.act V.pv.inh
#> 1 HM1 9 8 1.062 0.052 0.000118 0.058611
#> 2 HM2 8 7 1.180 0.059 0.000468 0.927939
#> 3 HM4 11 25 1.840 0.059 0.000002 0.007126
head(parameterEstimates(clusters$fit$HM1))
#> lhs op rhs est
#> 1 6647 ~ group -0.156
#> 2 10452 ~ group -0.021
#> 3 84134 ~ group -0.080
#> 4 79139 ~ group 0.000
#> 5 5530 ~ group -0.134
#> 6 5532 ~ group 0.169
head(parameterEstimates(clusters$fit$HM2))
#> lhs op rhs est
#> 1 54205 ~ group 0.056
#> 2 836 ~ group 0.200
#> 3 581 ~ group -0.013
#> 4 572 ~ group -0.045
#> 5 596 ~ group 0.127
#> 6 598 ~ group 0.198
head(parameterEstimates(clusters$fit$HM4))
#> lhs op rhs est
#> 1 4217 ~ group 0.086
#> 2 5606 ~ group 0.033
#> 3 5608 ~ group 0.188
#> 4 1432 ~ group -0.017
#> 5 5600 ~ group -0.296
#> 6 5603 ~ group 0.003
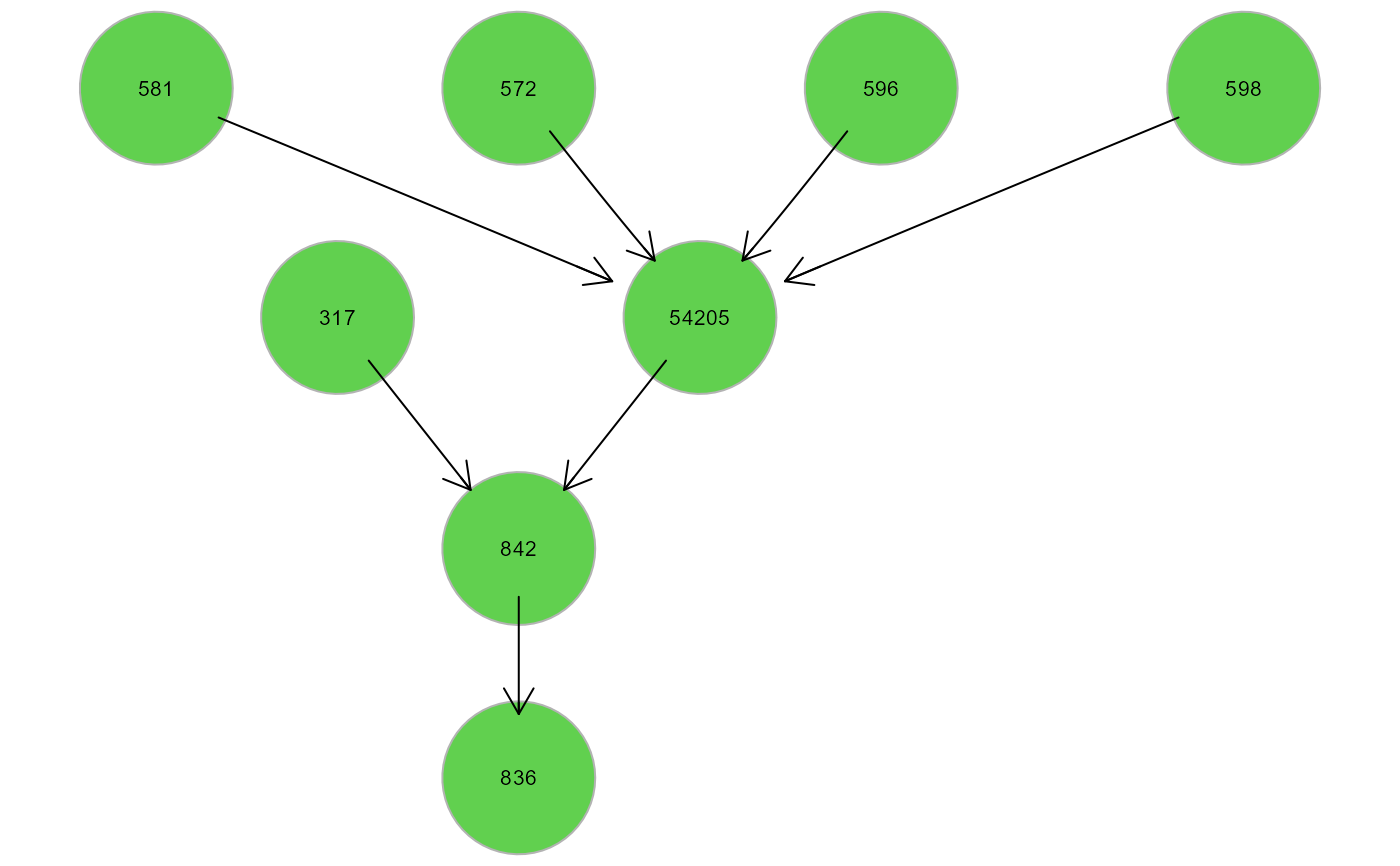
gplot(clusters$clusters$HM2)
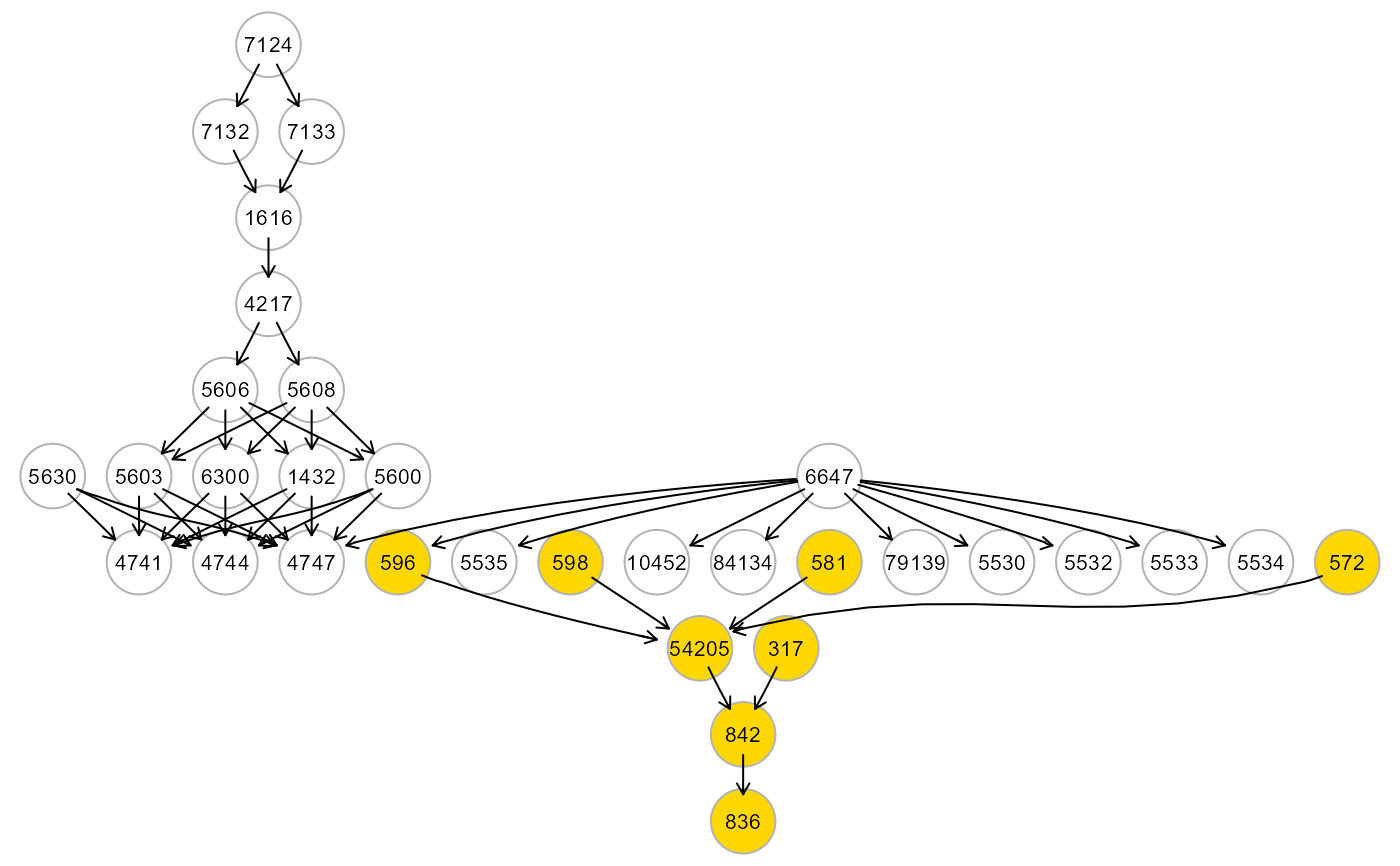
 # Map cluster on the input graph
g <- alsData$graph
c <- clusters$clusters$HM2
V(g)$color <- ifelse(V(g)$name %in% V(c)$name, "gold", "white")
gplot(g)
# Map cluster on the input graph
g <- alsData$graph
c <- clusters$clusters$HM2
V(g)$color <- ifelse(V(g)$name %in% V(c)$name, "gold", "white")
gplot(g)
 # }
# }