Wrapper for function renderGraph of the R package Rgraphwiz.
Usage
gplot(
  graph,
  l = "dot",
  main = "",
  cex.main = 1,
  font.main = 1,
  color.txt = "black",
  fontsize = 16,
  cex = 0.6,
  shape = "circle",
  color = "gray70",
  lty = 1,
  lwd = 1,
  w = "auto",
  h = "auto",
  psize = 80,
  ...
)
Arguments
- graph
An igraph or graphNEL object.
- l
Any layout supported by
Rgraphviz. It can be one among: "dot" (default), "neato", "circo", "fdp", "osage", "twopi".- main
Plot main title (by default, no title is added).
- cex.main
Main title size (default = 1).
- font.main
Main title font (default = 1). Available options are: 1 for plain text, 2 for bold, 3 for italics, 4 for bold italics, and 5 for symbol.
- color.txt
Node text color (default = "black").
- fontsize
Node text size (default = 16).
- cex
Another argument to control node text size (default = 0.6).
- shape
Node shape (default = "circle").
- color
Node border color (default = "gray70").
- lty
Node border outline (default = 1). Available options include: 0 for blank, 1 for solid line, 2 for dashed, 3 for dotted, 4 for dotdash, 5 for longdash, and 6 for twodash.
- lwd
Node border thickness (default = 1).
- w
Manual node width (default = "auto").
- h
Manual node height (default = "auto").
- psize
Automatic node size (default = 80).
- ...
Currently ignored.
Author
Mario Grassi mario.grassi@unipv.it
Examples
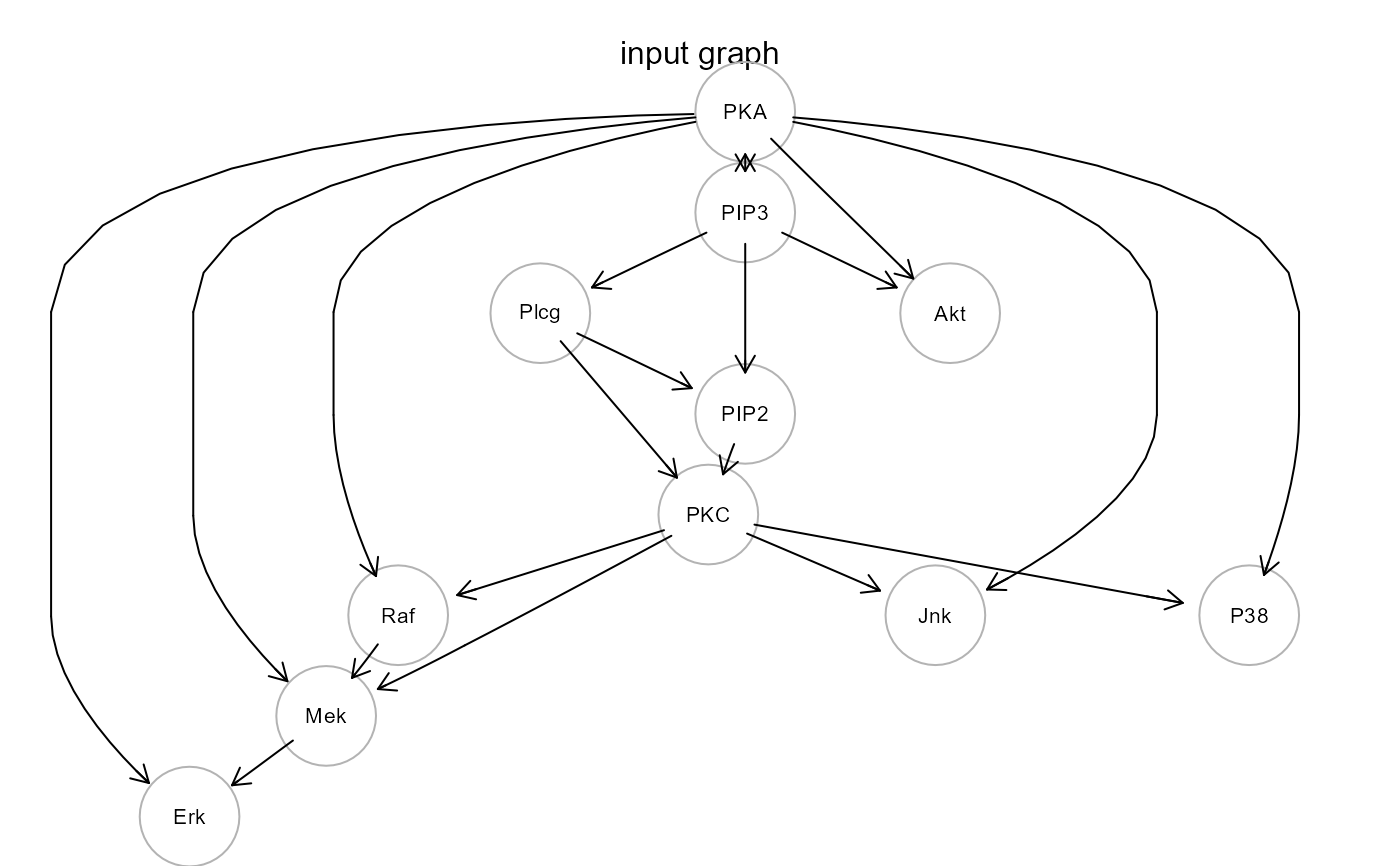
gplot(sachs$graph, main = "input graph")
 sem <- SEMrun(sachs$graph, sachs$pkc)
#> NLMINB solver ended normally after 8 iterations
#>
#> deviance/df: 188.9369 srmr: 0.103719
#>
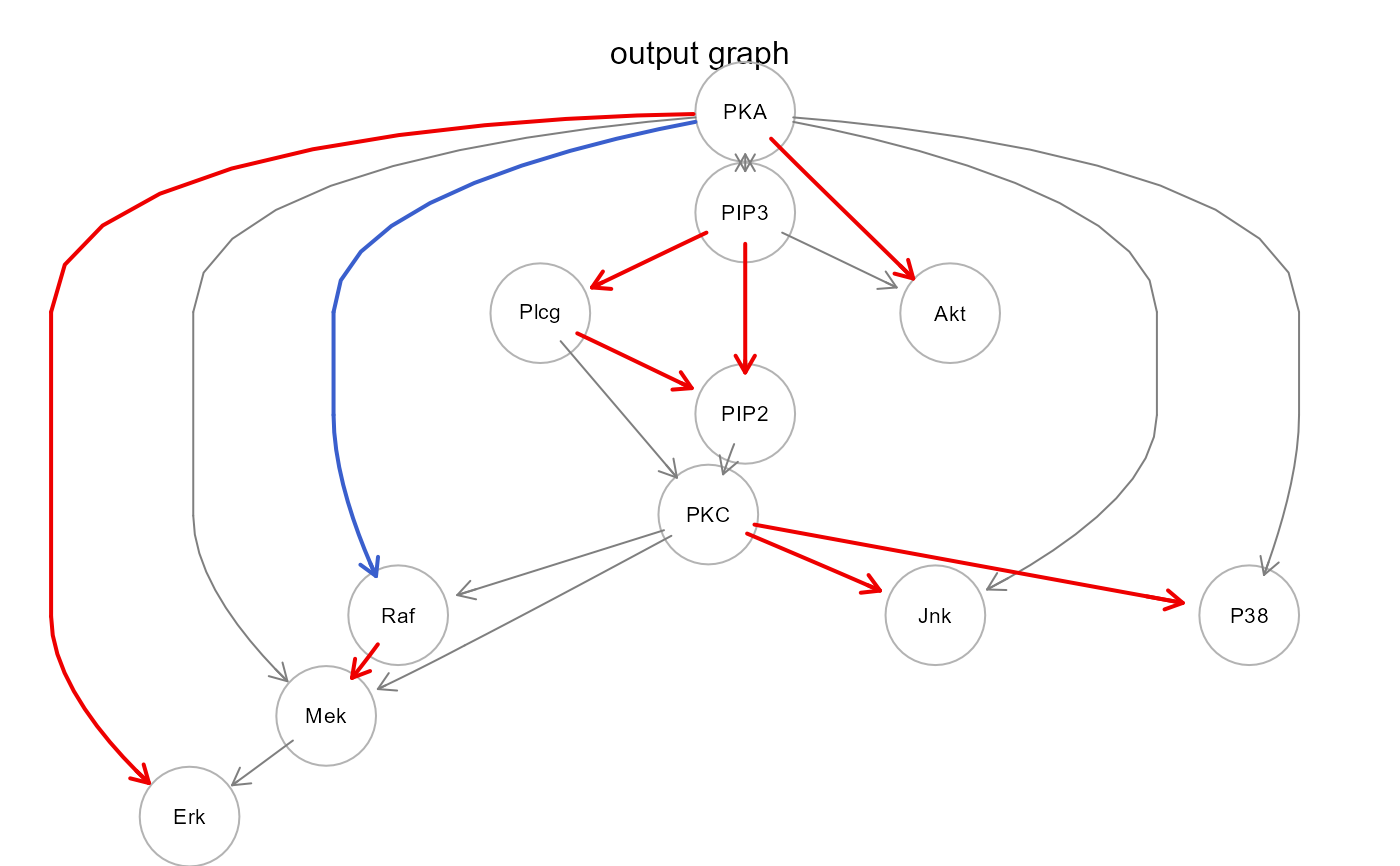
gplot(sem$graph, main = "output graph")
sem <- SEMrun(sachs$graph, sachs$pkc)
#> NLMINB solver ended normally after 8 iterations
#>
#> deviance/df: 188.9369 srmr: 0.103719
#>
gplot(sem$graph, main = "output graph")