Add vertex and edge color attributes to an igraph object,
based on a fitting results data.frame generated by
SEMrun.
Arguments
- est
A data.frame of estimated parameters and p-values, derived from the
fitobject returned bySEMrun. As an alternative, the user may provide a "gest" or "dest" data.frame generated bySEMrun.- graph
An igraph object.
- group
group A binary vector. This vector must be as long as the number of subjects. Each vector element must be 1 for cases and 0 for control subjects.
- method
Multiple testing correction method. One of the values available in
p.adjust. By default, method is set to "none" (i.e., no multiple test correction).- alpha
Significance level for node and edge coloring (by default,
alpha = 0.05).- vcolor
A vector of three color names. The first color is given to nodes with P-value < alpha and beta < 0, the third color is given to nodes with P-value < alpha and beta > 0, and the second is given to nodes with P-value > alpha. By default,
vcolor = c("lightblue", "white", "pink").- ecolor
A vector of three color names. The first color is given to edges with P-value < alpha and regression coefficient < 0, the third color is given to edges with P-value < alpha and regression coefficient > 0, and the second is given to edges with P-value > alpha. By default,
vcolor = c("blue", "gray50", "red2").- ewidth
A vector of two values. The first value refers to the basic edge width (i.e., edges with P-value > alpha), while the second is given to edges with P-value < alpha. By default ewidth = c(1, 2).
- ...
Currently ignored.
Author
Mario Grassi mario.grassi@unipv.it
Examples
# \donttest{
# Model fitting: node perturbation
sem1 <- SEMrun(graph = alsData$graph, data = alsData$exprs,
group = alsData$group,
fit = 1)
#> NLMINB solver ended normally after 1 iterations
#>
#> deviance/df: 12.66492 srmr: 0.303644
#>
#> Brown's combined P-value of node activation: 8.943957e-13
#>
#> Brown's combined P-value of node inhibition: 0.02173378
#>
est1 <- parameterEstimates(sem1$fit)
# Model fitting: edge perturbation
sem2 <- SEMrun(graph = alsData$graph, data = alsData$exprs,
group = alsData$group,
fit = 2)
#> Estimating optimal shrinkage intensity lambda (correlation matrix): 0.4547
#>
#> NLMINB solver ended normally after 7 iterations
#>
#> deviance/df: 16.91727 srmr: 0.3247998
#>
#> Brown's combined P-value of edge activation: 0.01363458
#>
#> Brown's combined P-value of edge inhibition: 0.8656962
#>
est20 <- subset(parameterEstimates(sem2$fit), group == 1)[, -c(4, 5)]
est21 <- subset(parameterEstimates(sem2$fit), group == 2)[, -c(4, 5)]
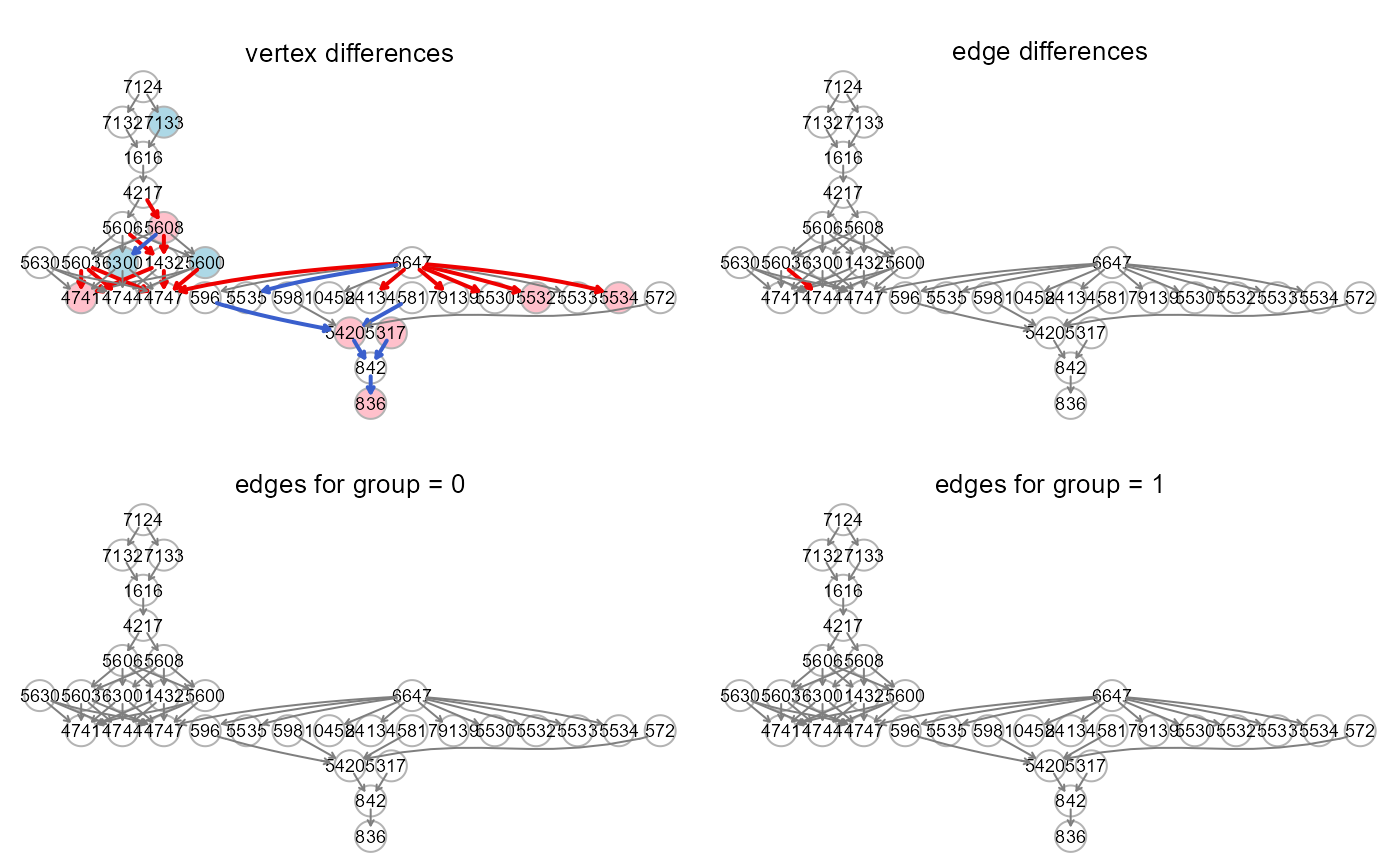
# Graphs
g <- alsData$graph
x <- alsData$group
old.par <- par(no.readonly = TRUE)
par(mfrow=c(2,2), mar=rep(1,4))
gplot(colorGraph(est = est1, g, group = x, method = "BH"),
main = "vertex differences")
gplot(colorGraph(est = sem2$dest, g, group = NULL),
main = "edge differences")
gplot(colorGraph(est = est20, g, group = NULL),
main = "edges for group = 0")
gplot(colorGraph(est = est21, g, group = NULL),
main = "edges for group = 1")
 par(old.par)
# }
par(old.par)
# }